Digital Governance · Digital Risk
Your real exposure, in the board's language
Attack surface, exposed credentials and control maturity, monitored continuously and translated into an index, incident risk and potential financial impact.
Digital Exposure Indices
58%
Average ExposureExecutive vs. Technical Analysis
Executive TechnicalTechnical discipline risks
Cybersecurity
Potential Incident Risk
82% High
Potential Financial Impact
14.5 USD millions
View detailsData governance
● Pending ⌛Answer the technical assessment to map your Maturity, Potential Incident Risk and Potential Financial Impact.
Fill in the assessment Assign completion →Ethical and legal AI use
Potential Incident Risk
71% High
Potential Financial Impact
25 USD millions
View details- Who it's for
- CISO, board and risk committee
- Replaces
- External ratings, scans and assessments under separate contracts
- Starts with
- Free assessment, with nothing to install and no access to your environment
What Digital Governance is
From exposure to decision and to trust
-
Digital Governance
Intelligence for strategic decision-making.
-
Digital Exposure
Knowing and measuring maturity, exposure and digital risks, in the context of the business.
-
Better decisions and lower risk
Prioritizing investments and actions by financial impact, criticality and risk appetite.
-
Digital Trust
Transparency, resilience and trust in relationships with clients, partners and investors.
More maturity. Less risk. Better decisions.
The digital trust cycle
A common yardstick for the business and the technical team
- 01
The business sets the appetite
By topic: cybersecurity, data governance and AI, the level of risk the company is willing to take.
- 02
Executives measure
The CISO, DPO and CAIO complete Verta-standard assessments, with curation and a proprietary framework.
- 03
The gap becomes visible
Appetite and exposure on the same chart, index by index, from regulatory to reputational.
- 04
The course is corrected
Invest, prioritize or maintain, with a phased plan and estimated return.
What goes up to the board
The findings stay with the technical team. The index goes to the board.
You declare, we verify: answers are checked against the attack surface and leaked credentials.
-
Digital Health
Attack surface and exposed credentials, for the company and its third parties, in a single digital health indicator.
-
Maturity versus the industry
Benchmarked against the Brazilian market, using MITI's Brazilian Digital Risk Survey.
-
Incident risk and potential financial impact
By scenario: ransomware, third parties, insider, resilience and operational.
-
Digital Trust Rating
From AAA to D, in the language of investors, banks and boards.
-
Cyber insurance eligibility
Shown right in the assessment, with Akad Seguros.
Risk indices
Every risk measured, compared with the market and read in the context of your business
The platform translates digital exposure into risk indices, each with a band, a grade and the global benchmark. Not every high risk is a priority: business context decides where the next dollar goes furthest.
-
One index per risk
Where you stand against the market
Ransomware, third parties, insider, regulatory, reputational and DDoS, each measured from 0 to 100%.
-
Band and grade
From Low to Critical, from A to D
Each index falls into a risk band and receives a grade, so the board can read the result without technical translation.
-
Global benchmark
Above or below the market
The triangle marks the global benchmark: ransomware and insider sit above the market; third parties and DDoS, below.
Risk indices example
- Company index
- Global benchmark
- Ransomware 42%
- Third parties 34%
- Insider 58%
- Regulatory 31%
- Reputational 24%
- DDoS 22%
Illustrative screen with sample data.
The platform in action
Exposed credentials and attack surface, read as business
External scanning shows what is exposed on the internet, for the company and for each third party, and updates with every cycle.
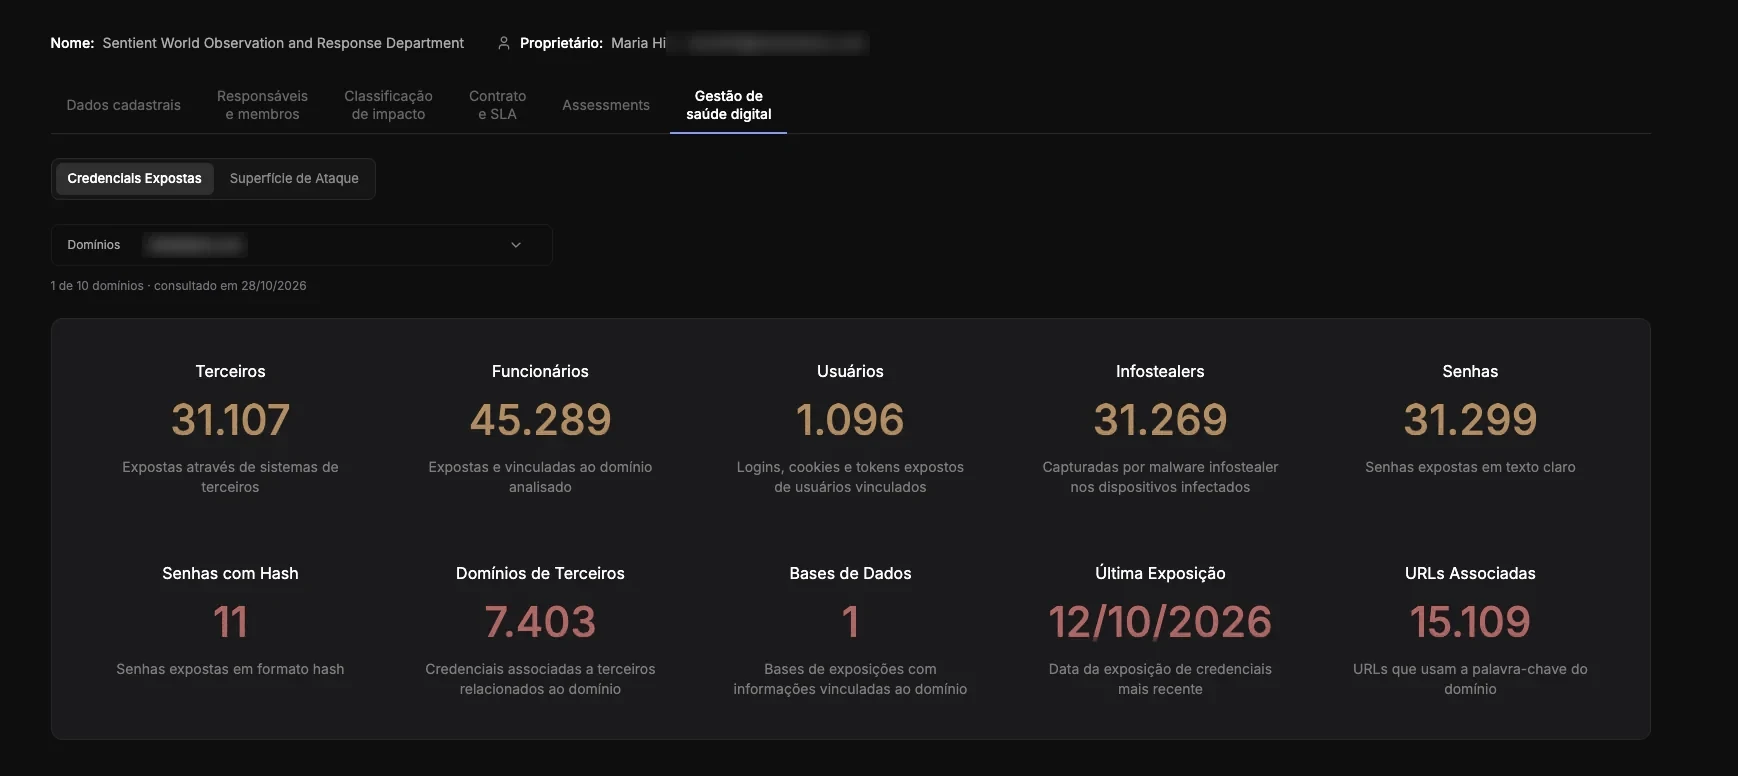
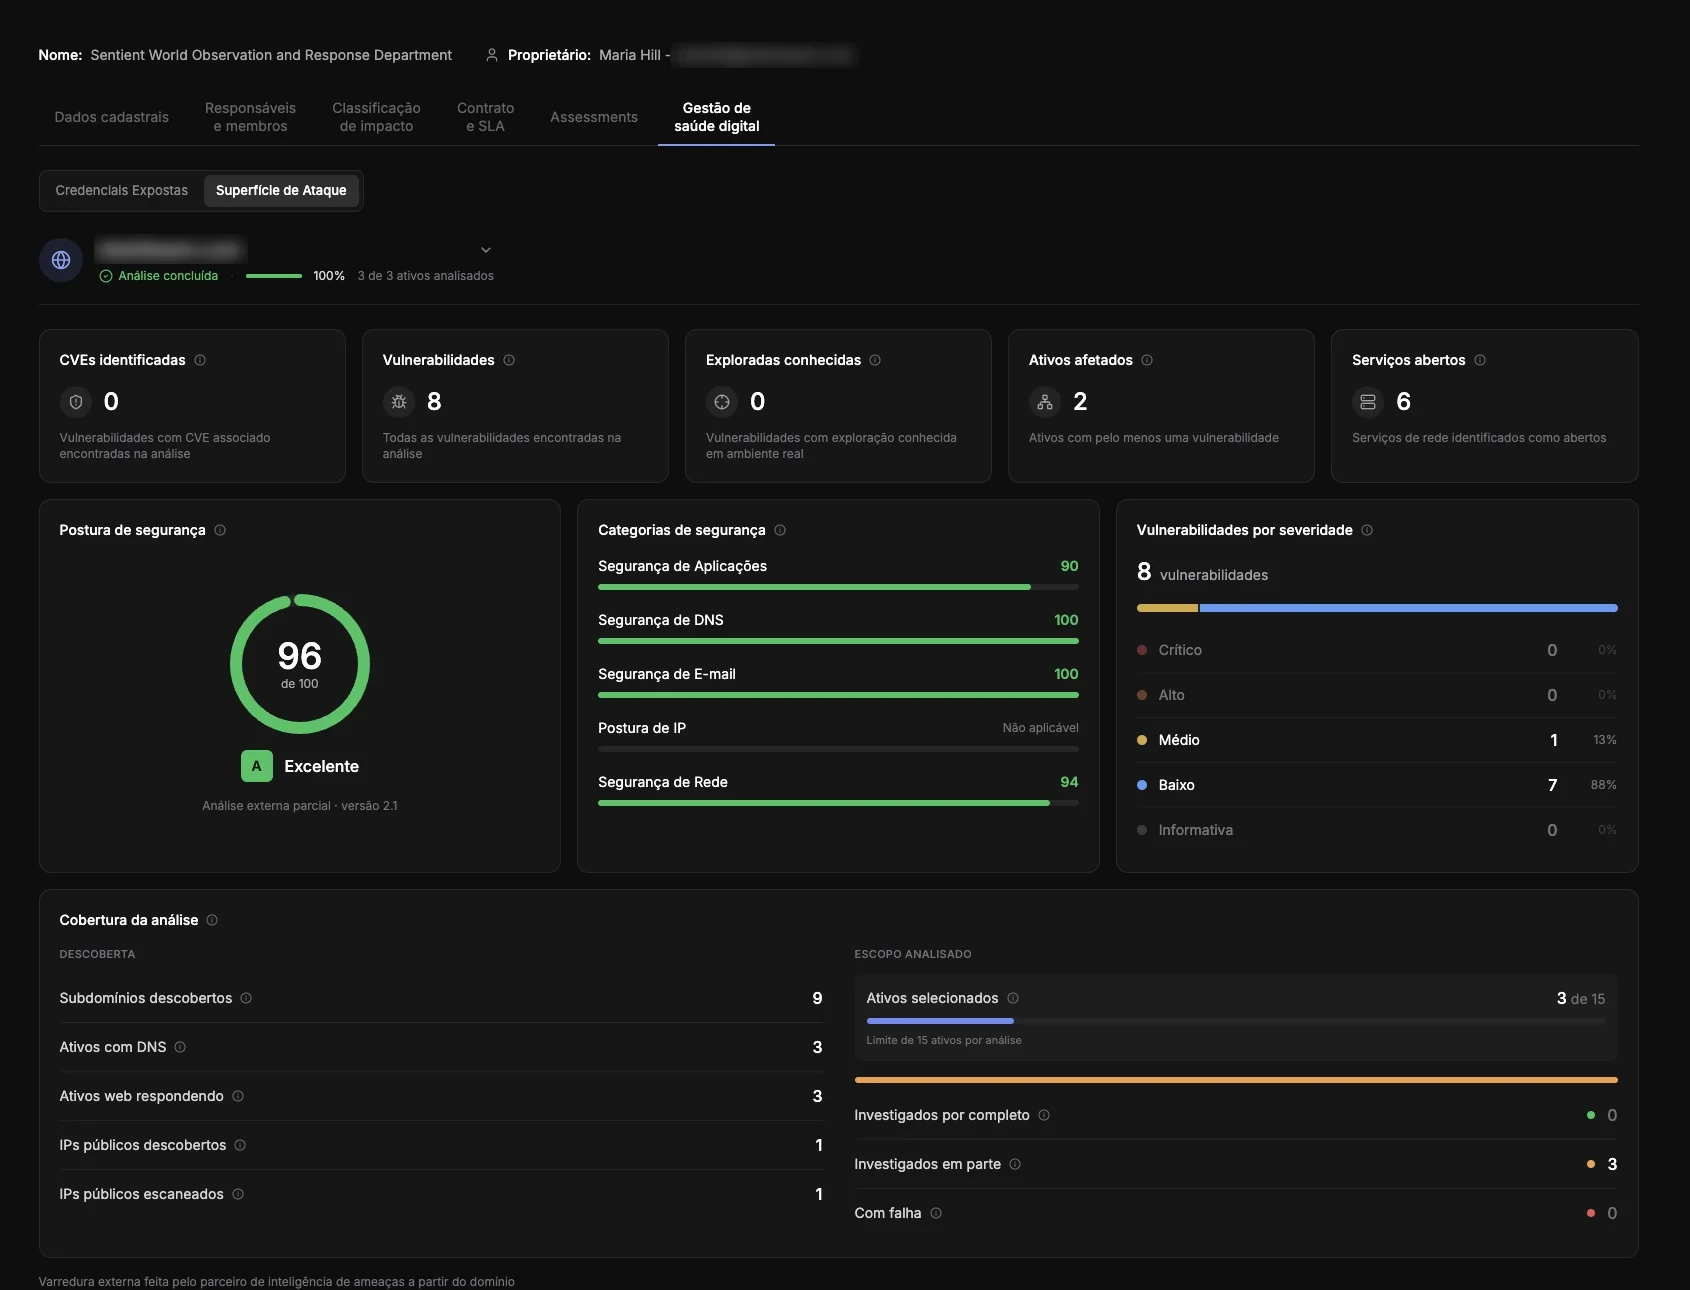
Screens from the demo environment. Names of people, e-mails and domains have been hidden.
- R$ 7.44M average cost of a data breach in Brazil Source: IBM Cost of a Data Breach 2026, Brazil
- ~30% lower cost with extensive use of AI and automation in security Source: IBM Cost of a Data Breach 2026, Brazil
- 16% of initial attack vectors lie in the supply chain Source: IBM Cost of a Data Breach 2026, Brazil
Connects the other domains
We know what is exposed and remove the problem at the source
Next step
Raise maturity. Reduce risk. Decide better.
Discover your digital exposure in board-level language, find out your cyber insurance eligibility, or discuss a proof of value at the entry point that weighs most today.